Tjóðartingsvalið í Stóra Bretlandi 2015
Appearance
| |||||||||||||||||||||||||||||||||||||||||||||||||||||||||||||||||||||||||||||||||||||||||||||||||
| |||||||||||||||||||||||||||||||||||||||||||||||||||||||||||||||||||||||||||||||||||||||||||||||||
| Litirnir vísa vinnandi flokkin, sum víst í høvuðstalvuni við úrslitum. | |||||||||||||||||||||||||||||||||||||||||||||||||||||||||||||||||||||||||||||||||||||||||||||||||
| |||||||||||||||||||||||||||||||||||||||||||||||||||||||||||||||||||||||||||||||||||||||||||||||||
Tjóðartingsvalið í Stóra Bretlandi í 2015 varð hildið hin 7. mai 2015. Tinglimir skuldu veljast til tað 56. tjóðartingsval Stóra Bretlands[1]
Úrslit
[rætta | rætta wikitekst]Atkvøður, av øllum, eftir flokki
Konservativu (36.8%)
Labour (30.5%)
UKIP (12.7%)
Liberal Democrats (7.9%)
SNP (4.7%)
Green (3.8%)
DUP (0.6%)
Plaid Cymru (0.6%)
Sinn Féin (0.6%)
UUP (0.4%)
SDLP (0.3%)
Other (1.1%)
Tinglimir, av øllum, eftir flokki
Konservativu (50.8%)
Labour (35.7%)
SNP (8.6%)
Liberal Democrats (1.2%)
DUP (1.2%)
Sinn Féin (0.6%)
Plaid Cymru (0.5%)
UUP (0.3%)
Green (0.2%)
Speaker (0.2%)
Sylvia Hermon (0.2%)
UKIP (0.2%)
Eftir at øll 650 valdømini vóru tald upp, vóru úrslitini hesi:[2][3]
| Flokkur | Floksformaður | Tingsessir | Atkvøður | |||||
|---|---|---|---|---|---|---|---|---|
| Av tilsamans | Av tilsamans | |||||||
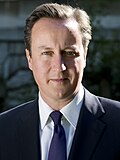
| Konservativi Flokkurin | David Cameron | 330 | 50.8% | 330 / 650 |
11,300,109 | 36.8% | ||
| Labour Party | Ed Miliband | 232 | 35.7% | 232 / 650 |
9,347,324 | 30.5% | ||
| Scottish National Party | Nicola Sturgeon | 56 | 8.6% | 56 / 650 |
1,454,436 | 4.7% | ||
| Liberal Democrats | Nick Clegg | 8 | 1.2% | 8 / 650 |
2,415,862 | 7.9% | ||
| Democratic Unionist Party | Peter Robinson | 8 | 1.2% | 8 / 650 |
184,260 | 0.6% | ||
| Sinn Féin | Gerry Adams | 4 | 0.6% | 4 / 650 |
176,232 | 0.6% | ||
| Plaid Cymru | Leanne Wood | 3 | 0.5% | 3 / 650 |
181,704 | 0.6% | ||
| Social Democratic & Labour Party | Alasdair McDonnell | 3 | 0.5% | 3 / 650 |
99,809 | 0.3% | ||
| Ulster Unionist Party | Mike Nesbitt | 2 | 0.3% | 2 / 650 |
114,935 | 0.4% | ||
| UK Independence Party | Nigel Farage | 1 | 0.2% | 1 / 650 |
3,881,099 | 12.7% | ||
| Green Party | Natalie Bennett | 1 | 0.2% | 1 / 650 |
1,157,613 | 3.8% | ||
| Speaker | John Bercow | 1 | 0.2% | 1 / 650 |
34,617 | 0.1%[4] | ||
| Independent | Sylvia Hermon | 1 | 0.2% | 1 / 650 |
17,689 | 0.06%[5] | ||
| 330 | 24 | 8 | 56 | 232 |
| Conservative | LD | SNP | Labour |
Fyrimynd:United Kingdom parliamentary election, 2015
| Vote share | ||||
|---|---|---|---|---|
| Conservative | 36.8% | |||
| Labour | 30.4% | |||
| UK Independence | 12.6% | |||
| Liberal Democrat | 7.9% | |||
| Scottish National | 4.7% | |||
| Green | 3.8% | |||
| Others | 3.7% | |||
| Parliamentary seats | ||||
|---|---|---|---|---|
| Conservative | 50.8% | |||
| Labour | 35.7% | |||
| Scottish National | 8.6% | |||
| Liberal Democrat | 1.2% | |||
| Democratic Unionist | 1.2% | |||
| Others | 2.4% | |||
Keldur
[rætta | rætta wikitekst]- ↑ "General election timetable 2015". Parliament of the United Kingdom. http://www.parliament.uk/about/how/elections-and-voting/general/general-election-timetable-2015/. Heintað 8 December 2014.
- ↑ "Live UK election results". http://www.theguardian.com/politics/ng-interactive/2015/may/07/live-uk-election-results-in-full. Heintað 8 May 2015.
- ↑ "Election 2015 results". BBC. http://www.bbc.co.uk/news/election/2015/results. Heintað 8 May 2015.
- ↑ "Speaker's results: Election 2015". BBC News. http://www.bbc.co.uk/news/politics/constituencies/E14000608. Heintað 25 September 2015.
- ↑ "BBC News election results". http://www.bbc.co.uk/news/politics/constituencies/N06000013. Heintað 25 September 2015.


